Write a chart component
Caplin Trader comes equipped with a set of APIs that allows you to obtain chart data from Caplin Liberator and other backend systems. It does not provide a fully-fledged chart component. Instead, the charting API is agnostic to the chart engine used, allowing you to use whichever charting library you wish. Handily, Caplin Trader already includes Highstock as a chart rendering engine.
In this tutorial you will be shown how to create a Highstock chart.
| Please refer to the this documentation if you’re unfamiliar with how components are created. This tutorial assumes you have a datasource supplying historic data for GBPUSD in the Caplin Platform backend you are connected to. |
We are now going to create a simple chart component that will, when loaded, request and display chart series data for the /FX/GBPUSD instrument.
Here’s how…
Creating the chart blade
First create a chart bladeset and a blade named simplechart. Then create a Component.js file in the src folder of the new blade.
The next step is to tell BladeRunnerJS that we will be using Highstock so it gets loaded in the page:
caplin.thirdparty('highstock');Now define a Component class and make it implement two interfaces. The Component interface will allow us to use a layout manager such as Webcentric and SeriesListener which allows you to receive chart series data.
myapp.chart.simplechart.Component = function() {
};
caplin.implement(myapp.chart.simplechart.Component, caplin.component.Component);
caplin.implement(myapp.chart.simplechart.Component, caplin.chart.series.SeriesListener);
Note: In a bespoke chart component you would also implement the caplin.chart.Chart interface, which allows our chart component to work in workbenches along with the chart workbench tools that are part of Caplin Trader.
|
Creating the DOM container for our chart
Here we are going to add some methods that will allow the chart component to be displayed inside a layout manager. We also need to create a DOM element into which the chart will be rendered, the class requires a getElement method so that the layout manager can insert our component into the application.
Create a DOM element in our constructor.
this._rootElement = document.createElement('div');Define a getElement method.
myapp.chart.simplechart.Component.prototype.getElement = function() {
  return this._rootElement;
};
Create an onOpen method that will save the dimensions of the component, so that you are able to pass the dimensions to Highstock later on.
myapp.chart.simplechart.Component.prototype.onOpen = function(width, height) {
  this._width = width;
  this._height = height;
};
Requesting chart series data
The chart component will display one instrument when it loads, so let’s request the data from our Liberator backend. Do this by creating a SeriesRequest that describes what kind of data we would like to request, then pass it to a new Series object.
...
this._request = new caplin.chart.series.SeriesRequest({
  instrument: '/FX/GBPUSD',
  interval: '1d', // one day
  type: caplin.chart.series.SeriesRequest.REQUEST_HISTORIC // historic data
});

this._series = new caplin.chart.Series(this._request);
this._series.addListener(this);
This will request historic data for the /FX/GBPUSD instrument with a one day interval.
Receiving chart series data
You may be wondering at this point when we will actually use Highstock, and rightly so! Highstock has a limitation where a chart cannot be created without any data. So let’s get some data from our request and create the Highstock chart.
To receive chart series data implement the SeriesListener interface, this defines three methods: onSeriesData, onSeriesStatusUpdate and onSeriesError. For this tutorial we will only implement the first two and we won’t handle errors. Please refer to the charting API documentation to implement these methods later.
myapp.chart.simplechart.Component.prototype.onSeriesStatusUpdate = function(seriesId, newStatus) {
  // log the status update into the console
  console.log('#onSeriesStatusUpdate', this._series, ', status:', newStatus);
};

myapp.chart.simplechart.Component.prototype.onSeriesData = function(seriesId, chartData) {
  // for now just log the data into the console
  console.log('#onSeriesData', chartData);
};
Now load the component into our app, and view the browser’s console to see that you have received charting data.
Creating a Highstock chart
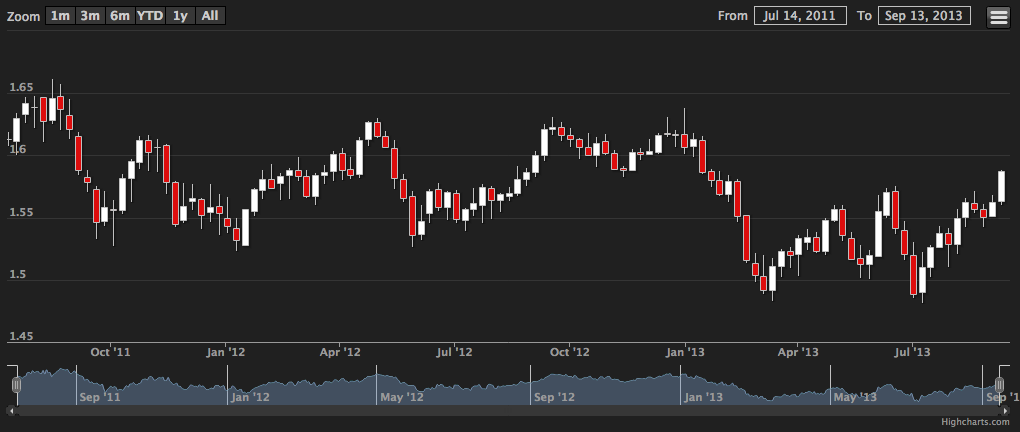
We are going to create our Highstock chart in the onSeriesData method. Highstock has a plethora of options but we will only use a few, please refer to the Highstock documentation for details. Replace the contents of onSeriesData with the code below.
this._chart = new Highcharts.StockChart({
  series: [
    {
      id: this._request.getId(),
      type: 'candlestick',
      name: this._request.getDisplayName(),
      data: chartData
    }
  ],
  chart: {
    renderTo: this._rootElement,
    width: this._width,
    height: this._height
  }
});
This simple chart component we’ve just created should now look something like this: