Add a study to my chart
In this tutorial we will outline how to add a study to the chart component we created in the "Write a chart component" tutorial. So if you haven’t already, you might want to take a look at that first!
Here we will be adding the SimpleMovingAverage study to our series object and have it display the study data on the chart.
Here’s how….
Adding a study
Now that we have a working chart component, we are able to apply a study to the data we have displayed. To do this we call the addStudy method on our series object.
We will then add this to our constructor, just behind the line of code that creates the series object.
this._series = new caplin.chart.Series(request, this);
this._series.addStudy('caplin.chart-sma-study', { period: 2 });
This will add a SimpleMovingAverage with a period of 2, to our series object.
Implementing the interface
Our code currently triggers an error, this is because we added a study but haven’t yet implemented the StudyListener interface. So we will need to add the required line of code shown below, after the existing caplin.implements statements.
...
caplin.implement(novox.chart.simplechart.Component, caplin.chart.study.StudyListener);
We will then implement the onStudyData method that will, for now, log the received study data to the browser’s console.
novox.chart.simplechart.Component.prototype.onStudyData = function(study, points) {
  console.log('#onStudyData', study, points);
}
Receiving study data
We will now modify the onStudyData to create a new Highstock series and add it to our chart, similar to how we created the chart component in onSeriesData here.
There is however one difference, in that the study will not send all the data at once, but in batches of 100. So we will need to add some logic that will create the new Highstock series once it receives the first batch, and then just add the data to the previously created Highstock series for each consecutive batch.
novox.chart.simplechart.Component.prototype.onStudyData = function(study, points) {
  var hcSeries = this._chart.get(study.getId());

  if (!hcSeries) {
    // create the series for the study
    this._chart.addSeries({
        id: study.getId(),
        type: study.getRepresentationTypes()[0],
        name: study.getDisplayName(),
        data: points
      }, true, false);
  } else {
    // add new batch data to series
    points.forEach(function(point) {
      hcSeries.addPoint(point, false, false, false);
    });

    this._chart.redraw();
  }
};
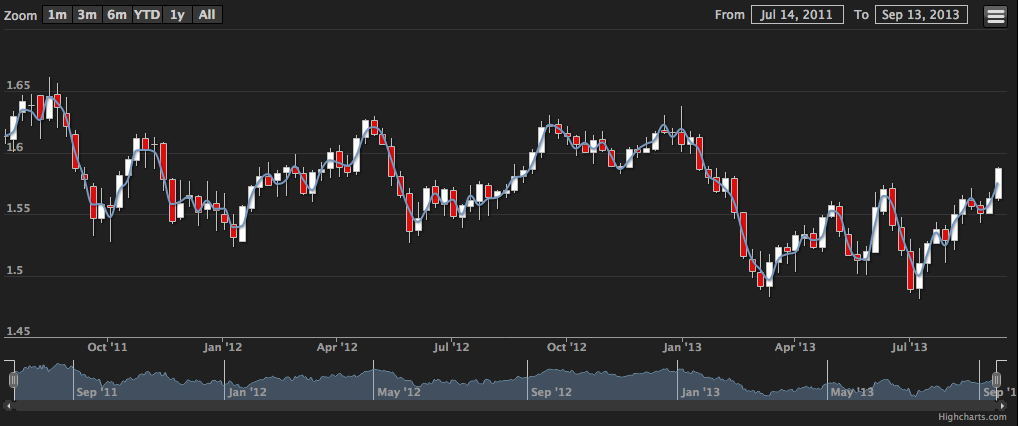
Our chart component will now display chart study data and should look something like this:
