Publishing alerts from Prometheus
This page describes how you can configure Prometheus to monitor Liberator and publish alerts to Slack, raise alerts when Liberator is down, and publish those alerts to Slack via the Alertmanager alert message router.
Introduction to Prometheus in Caplin Platform
All Caplin Platform applications export a core set of Prometheus metrics supplemented by metrics specific to the application. See, for example, Liberator’s Prometheus metrics.
Enabling Prometheus endpoints
To enable the Prometheus endpoint in a Caplin application, set the application’s prometheus-port configuration item to a free port on the host.
Liberator 8, when deployed to the Caplin Deployment Framework, is configured by default to publish Prometheus metrics on port 8083:
prometheus-port 8083
The Prometheus endpoint is available at the URI /metrics:
http://<host>:<prometheus-port>/metrics
Instrumenting your own Java DataSource adapters
If you write your own Java DataSource adapters, you can supplement the default Caplin Java DataSource metrics with metrics specific to your application.
Java DataSources use Micrometer for instrumentation. To add a custom metric to an adapter’s Prometheus endpoint, use Micrometer’s Metrics class:
import io.micrometer.core.instrument.Metrics;

requestCountGauge = Metrics.globalRegistry.gauge(appName + "request.count", new AtomicInteger(0));
For more information on creating your own custom metrics, see the following resources:
Walkthrough
In this walkthrough, we will deploy Liberator, Prometheus, and Alertmanager, and configure Prometheus and Alertmanager to publish alerts to Slack.
Deploy Liberator 8
Liberator 8 can be deployed in three different ways:
-
Deploy to the Caplin Deployment Framework
-
Deploy as a standalone server
-
Deploy as a Docker image
For the purposes of this walkthrough, we’ll keep things simple and run Liberator in the Platform Core Docker image, available from the docker-release.caplin.com registry (Caplin account required).
-
Open a new terminal and run the command below to start Liberator in a Platform Core 8 container:
docker run --rm --name liberator --interactive --tty --publish 8083:8083 --publish 18080:18080 docker-release.caplin.com/platform/core:8.0.0 /app/DeploymentFramework/dfw start-fg Liberator
The command above runs Liberator in an interactive foreground container. When you want to stop Liberator, press Ctrl-C in the terminal window.
-
To view the metrics exported by Liberator, navigate to http://localhost:8083/metrics. You will see output resembling the sample below:
# HELP rttpd_session_connections_permitted gauge
# TYPE rttpd_session_connections_permitted gauge
rttpd_session_connections_permitted 1
# HELP rttpd_process_fds gauge
# TYPE rttpd_process_fds gauge
rttpd_process_fds{type="non_socket_fds"} 27
rttpd_process_fds{type="socket_fds"} 535
# HELP rttpd_data_service_messages_read_total counter
# TYPE rttpd_data_service_messages_read_total counter
rttpd_data_service_messages_read_total{service_name="broadcast",message_type="nodata"} 0
rttpd_data_service_messages_read_total{service_name="ContainerTestsService",message_type="map"} 0
Install Prometheus
In this section, we’ll install Prometheus and configure an alert when Liberator is down.
Follow the steps below:
-
Download the latest version of Prometheus from the Prometheus Download page, and extract it to a local directory:
Example directory structure following download and extraction -
In the Prometheus root directory, edit
prometheus.ymland add a scrape job for Liberator in thescrape_configssequence:prometheus.ymlscrape_configs: - job_name: "liberator" scrape_timeout: 30s scrape_interval: 40s static_configs: - targets: ["localhost:8083"] -
In the Prometheus root directory, create a
rules.ymlfile containing the content below:rules.ymlgroups: - name: liberator rules: - alert: InstanceDown expr: up == 0 for: 1mFor more information on writing alerting rules, see Alerting rules.
-
In the Prometheus root directory, edit the
prometheus.ymlfile and addrules.ymlto therule_filessequence:rule_files: # - "first_rules.yml" # - "second_rules.yml" - "rules.yml" -
If Liberator is not already running, open a new terminal and start Liberator now:
docker run --rm --name liberator --interactive --tty --publish 8083:8083 --publish 18080:18080 docker-release.caplin.com/platform/core:8.0.0 /app/DeploymentFramework/dfw start-fg Liberator
-
In the Prometheus root directory, start Prometheus:
./prometheus
-
In a web browser, navigate to http://localhost:9090 to confirm that Prometheus is running:
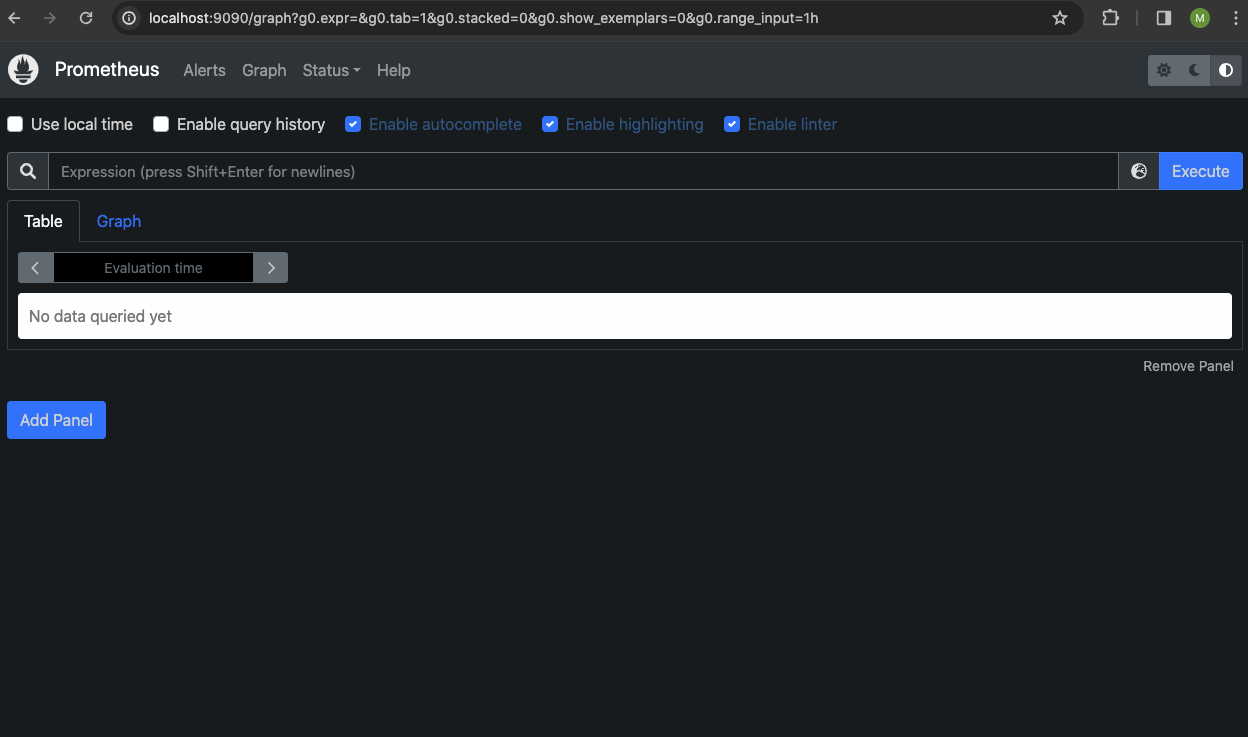
-
On the Prometheus home page, click Status > Targets to confirm that Prometheus has detected that the Liberator is 'up':
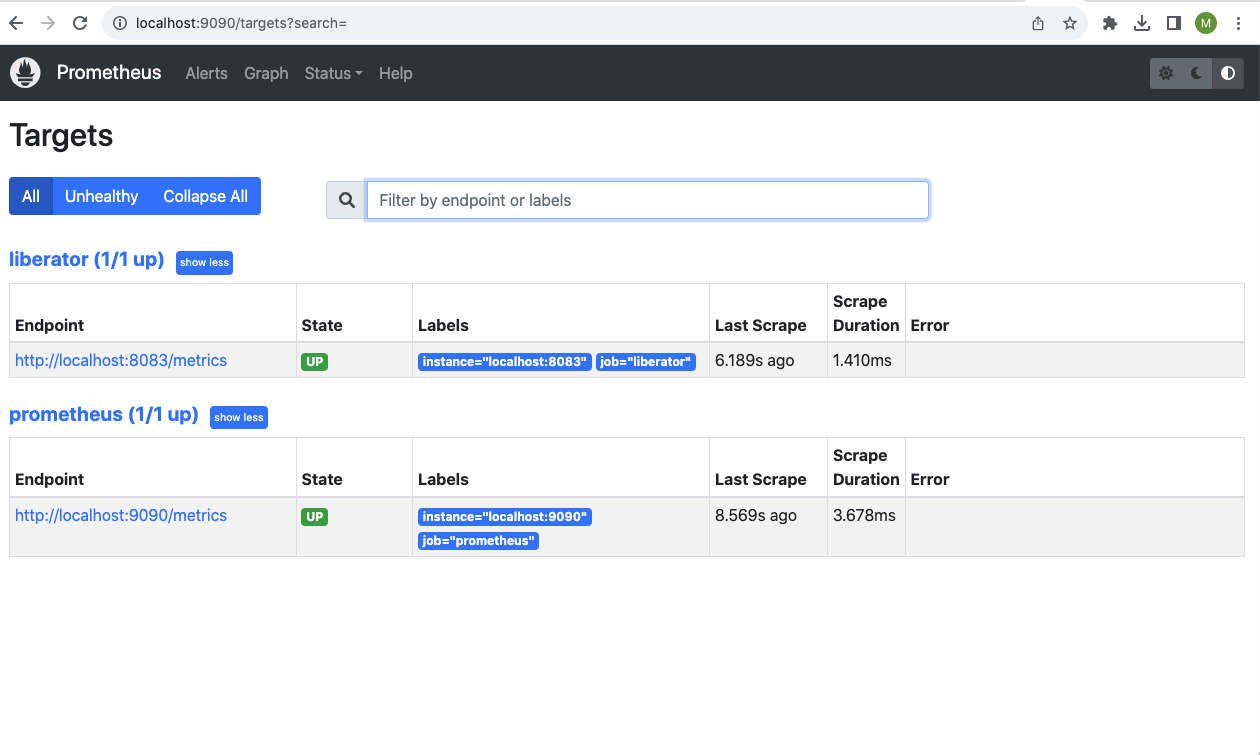
-
In the Liberator terminal window, press Ctrl-C to stop the Liberator.
-
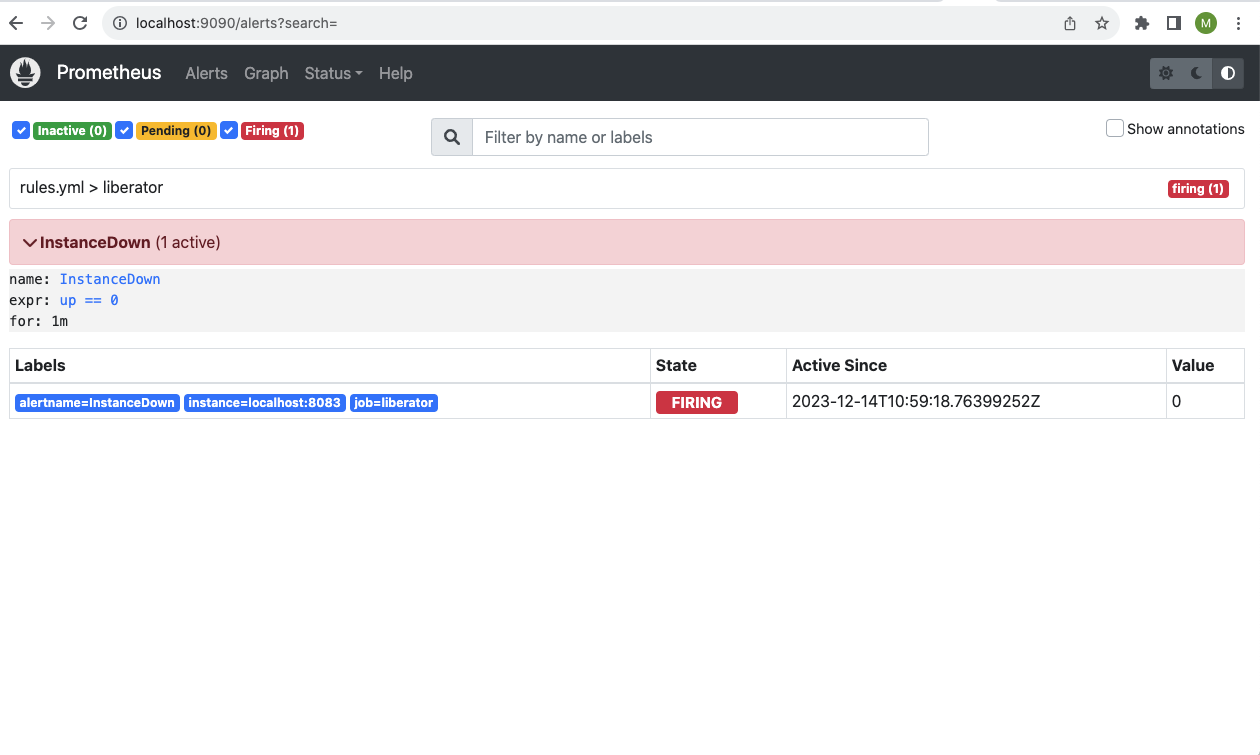
In Prometheus, click Alerts. Notice that Prometheus has fired an alert for Liberator’s status change:
Install Alertmanager and route alerts to Slack
In the previous section we configured an alerting rule for a Liberator status change. At this point, the alert is visible only in the Prometheus GUI. To publish the alert to Slack, we use Prometheus’s sister application: Alertmanager.
Follow the steps below:
-
Download Alertmanager from the Prometheus Download page and extract to a local directory:
Example directory structure following download and extraction
-
In Slack’s Manage Apps settings, create a webhook URL for the Slack channel you want to post alerts to.
-
Add the following configuration to Alertmanager’s
alertmanager.ymlconfiguration file:alertmanager.ymlglobal: resolve_timeout: 1m slack_api_url: '<your_webhook_url>' route: receiver: 'slack-notifications' receivers: - name: 'slack-notifications' slack_configs: - channel: '#<your_slack_channel>' send_resolved: true -
Add the configuration below to your
prometheus.ymlfile to provide Prometheus with the location of your Alertmanager. By default, Alertmanager runs on port 9093.prometheus.yml# Alertmanager configuration alerting: alertmanagers: - static_configs: - targets: - localhost:9093 -
If Liberator is not already running, start Liberator. Navigate to http://localhost:18080 to confirm Liberator has started.
docker run --rm --name liberator --interactive --tty --publish 8083:8083 --publish 18080:18080 docker-release.caplin.com/platform/core:8.0.0 /app/DeploymentFramework/dfw start-fg Liberator
-
Start Alertmanager. Navigate to localhost:9093 to confirm Alertmanager has started.
./alertmanager
-
Start Prometheus. Navigate to localhost:9090 to confirm Prometheus has started.
./prometheus
-
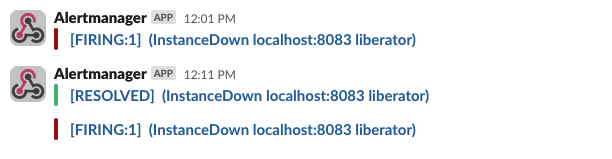
In the Liberator terminal window, press Ctrl-C to stop the Liberator.
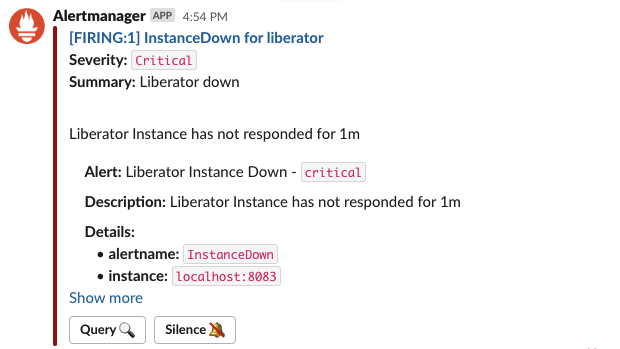
Alertmanager sends a message to your configured Slack channel. For example:
More informative and interactive alerts can be created by using the Alertmanager’s templating syntax to produce alerts similar to the example below:
For a detailed reference on configuring Alertmanager, including how to customise the presentation of alert notifications, see Alerting in the Prometheus documentation.