Adding Monitorable Components
Once you’ve installed the CMC, you may want to want to add Caplin components to monitor, in addition to the components that you configured using the ./dfw mon command (Liberator and optionally Transformer).
1. Add another monitorable Caplin component
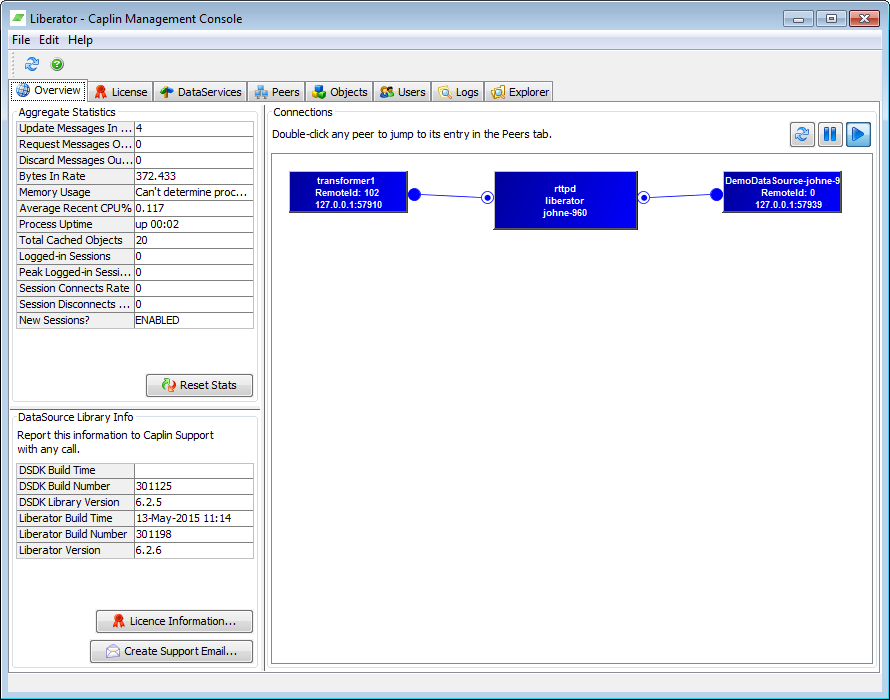
We’re assuming that you’re now looking at the CMC Overview Screen:
Follow the procedure below to start monitoring:
-
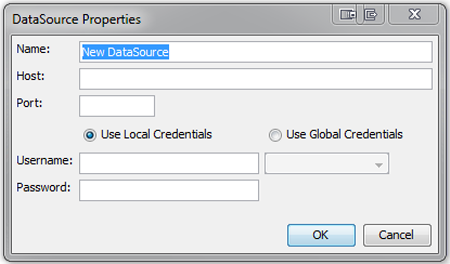
First of all, right-click in the centre of the main window, and then select the Add New DataSource… option. The DataSource Properties dialog box appears:
-
Now, complete the fields as follows:
Field name Description Name
Free text name for the component.
Host
IP address or DNS name of the machine that the component is running on.
Port
Port that JMX Monitoring has been set up on. This must correspond to the
rmi-registry-portproperty that was set in thejmx.confconfiguration file when setting up the Platform component.Use Local Credentials
Select to authenticate using local credentials. In this case, you must also specify a username and password.
Use Global Credentials
Select to authenticate using global credentials. In this case, you must also select a configured global authentication method from the dropdown.
These authentication methods need to be configured in the configuration file for the Caplin Product (
rttpd.conffor Liberator,transformer.conffor Transformer, or the Datasource configuration file). -
Now click OK.
2. View monitored component
If both the CMC and the relevant Caplin component have been configured correctly, you should now be looking at a blue rectangle representing your component. In CMC, active components are blue, and inactive ones red. So, red would mean that the CMC was unable to connect to the Caplin component. In this case a brief explanation of what is wrong is available as a tool-tip which can be viewed by mouse hovering over the Caplin component.
3. Add more components
You can add as many other components to monitor as you like by repeating steps 1 and 2 above. Every time you add a new component, the CMC will automatically detect and display any linkages between them (for example, an Integration Adapter is connected to a Caplin Liberator).