Monitor latency using the CMC
Once you’ve enabled the recording of latency in record updates, the latency chain data is available in Liberator and can be accessed via JMX monitoring. You can view it using a JMX console, such as the Caplin Management Console (CMC). Here’s how to do this with the CMC.
| This feature is available in Liberator 6.2.7 and later. |
When a liberator object has latency information recorded against it, you can view this data by examining the object’s MBean attribute called latency-chain . The information’s presented as a JSON map that contains latency data for a period (default 5 minutes) governed by the setting of the configuration item object-latency-stat-period At the end of this period, the data is reset and the calculation (averaging) starts again.
The JSON map has the form:
{ "A->B" : { "min" : <min-millisec>, "max" : <max-millisec>, "avg" : <avg-millisec>, "count" : <count>} }
where A -> B identifies the hop to which the latency data applies. For example, datasource_X->Liberator_E is the hop where data for the object left the Integration Adapter called "datasource" (X for eXit) and entered the Liberator called "Liberator" (E for Entry).
-
First set up your Integration Adapter(s), Transformer(s) and Liberator(s) to record latency information; see How can I… Record latency in record updates.
-
Start the CMC (see step 3 in Installing the CMC).
-
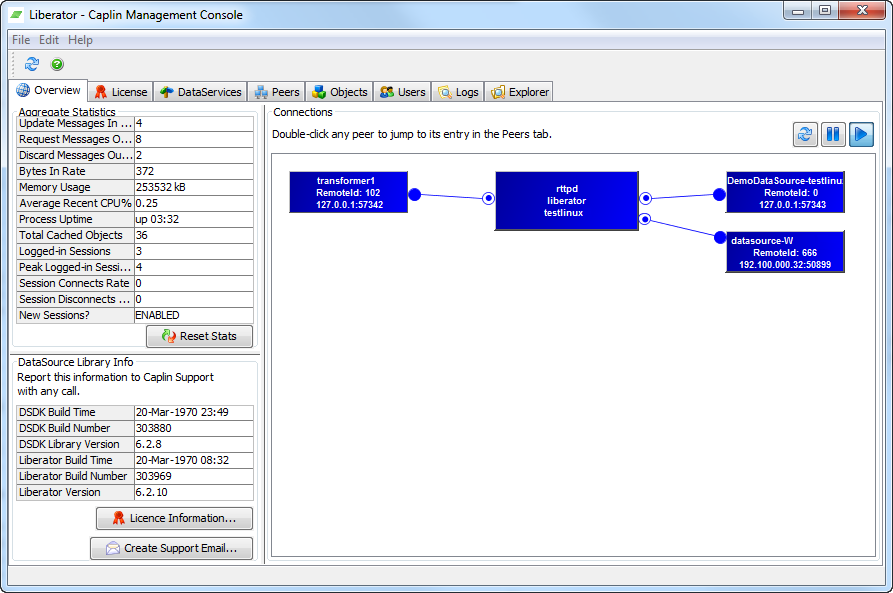
Double click on the Liberator box that’s displayed in the initial CMC window and you should see a new CMC screen that shows the details of the Liberator and its connections to the other Platform components in your installation.
For example:
-
Select the Explorer tab, and in the MBean Explorer window at the top left, select the rttb.cache.object entry. Drill down through the hierarchy to select the MBean for the object whose latency data you wish to view. For example, here’s the Mbean for the object (in the test system we used) whose subject is
/PLATYPUS/SUBSCRIBE/RECORD1The
latency-chainattribute of the MBean contains the current latency information (highlighted in blue in the screenshot).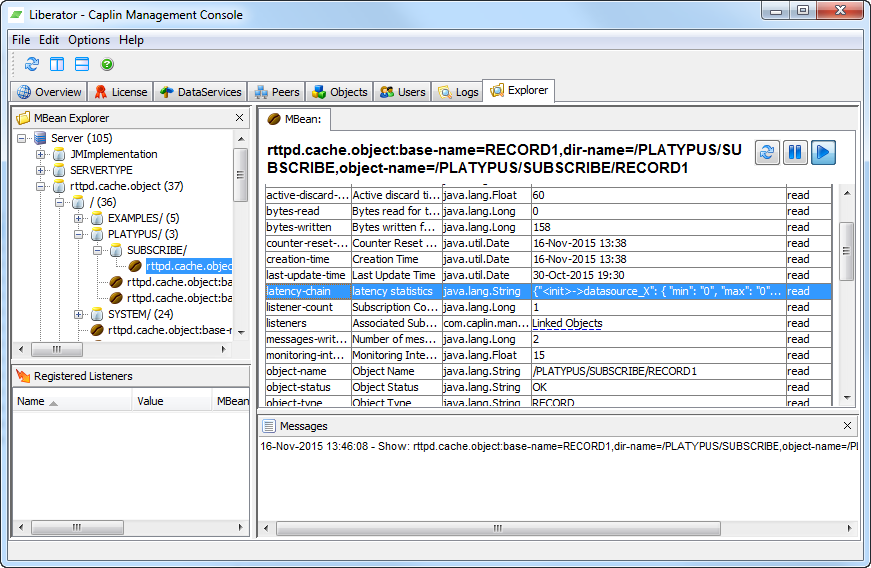
-
Double click on the
latency-chainattribute (anywhere on the line) to bring up the Attribute Viewer window: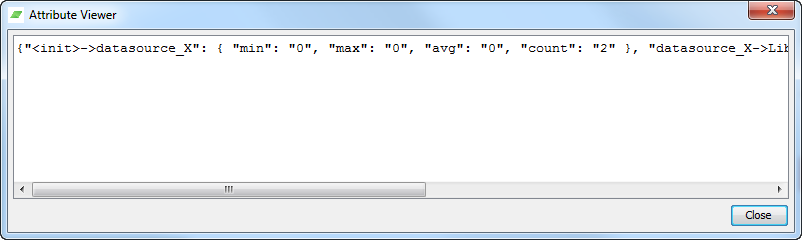
You can now inspect the full JSON map containing the latency measurements, which in this example is:
{
    "<init>->datasource_X": { "min": "0", "max": "0", "avg": "0", "count": "2" },
    "datasource_X->Liberator_E": { "min": "4", "max": "10", "avg": "7", "count": "2" }
}
You can also select the text in the window and copy and paste it as required.
See also:
-
How can I… Record latency in record updates
-
Reference: Latency chains configuration