Record latency in record updates
You can configure your DataSource applications so they record the latency of data updates to each record as the record passes from one application to the next.
- How does latency recording work?
- What record types can hold latency data?
- How do I record the initial timestamp?
- How do I turn latency recording on and off?
- How do I change the names of latency chain fields?
- How can I add application-specific timestamps?
- How does Liberator throttling and bursting affect message latency measurement?
How does latency recording work?
A record typically passes through a number of DataSource applications running on the Caplin Platform; for example, a record containing an update to the price of an FX instrument could originate from a Pricing Adapter that’s connected to an external pricing system, the record may pass through a Transformer (perhaps to be filtered), and then through a Liberator before ending up in a client application such as a Caplin Trader application.
The update takes a finite time to pass from the Pricing Adapter to Transformer and on to Liberator. Each of these components adds a processing delay, and the update also takes time to travel through the network connecting one component to another. This is illustrated in the following diagram:
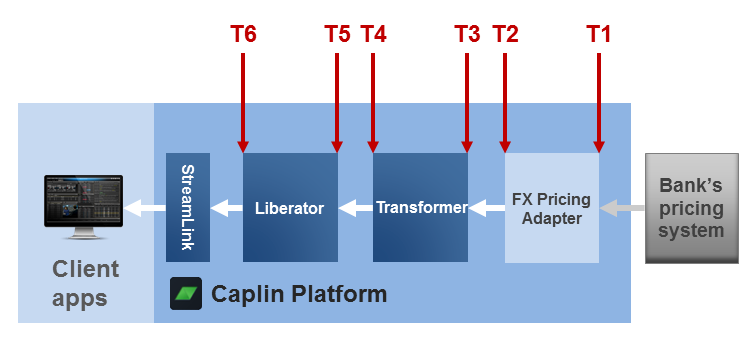
Here an FX Pricing Adapter (Integration Adapter) receives an FX price record from a pricing system at time T1. The record exits the FX Pricing Adapter at time T2 and enters a Transformer at time T3. The Transformer sends the record on to a Liberator at time T4, which is received at time T5 and is passed on to a StreamLink client at time T6.
You can configure each of the DataSource applications in the chain (Pricing Adapter, Transformer, Liberator) to add timestamps to the update record, so the record contains a history of how long it spent at each significant point - this is called the latency data chain. The timestamps should have a resolution of 1 millisecond.
| The latency recording system relies on all the machines hosting the DataSource applications having their clocks synchronised. |
Latency recording is really only meant to be used as a tool for tuning your system, so although you can embed latency data in your "live" data, this can add an extra unwanted overhead. Therefore we recommend that you generate special record updates specifically for latency measurement. For example, assume you want to measure the latency of FX data originating from an FX Pricing Adapter. Rather than adding latency data to all the record updates for subjects starting with /FX/, instead code the FX Pricing Adapter so at intervals it additionally creates updates with the special subject /FX/LAT - these updates only contain latency data.
You code the Adapter that originates the update so that it adds an initial timestamp to the record. By default, the latency configuration for a DataSource application assumes that the field containing this initial timestamp is called LTY_INIT_TS. But, you can choose a name of your own, provided you configure all the DataSource applications that handle the update to recognise this name (see the configuration item latency-chain-init-ts-field).
Here’s an example of an update record containing (only) latency chain data:
Record subject: /FX/LAT
| Field type | field name (default CONFIG) | field value |
|---|---|---|
|
|
|
List of events: |
|
|
List of timestamp deltas: |
|
|
Here’s how to read this record:
The FX Pricing Adapter adds the initial millisecond timestamp in field LTY_INIT_TS
Then the Adapter adds an event called fxadapter1_E to the events list field (LTY_LIST_EVENT), and to the timestamp deltas list field (LTY_LIST_TS) it adds the time of the event in milliseconds since the initial timestamp. The event name consists of the DataSource application name (fxadapter1) with an E appended. E means "Entry" - the time when the record "entered" the DataSource application (in this case its the time when the record was created, which is the same as the initial timestamp).
When the Adapter finally sends the update record on to the Transformer, it adds another event called fxadapter1_X to the events list field, and adds the time of this event in milliseconds since the initial timestamp to the timestamp deltas list field. The X suffix of course means "Exit", as it’s the delta time when the record left the Adapter.
Transformer and Liberator add their own entry and exit delta times as the update record passes through them, so the list of events and corresponding delta times is built up like this:
| Event | Delta time (MSec) | Meaning |
|---|---|---|
|
|
Time elapsed between initial timestamp and entering fxadapter1 |
|
|
Time elapsed between initial timestamp and exiting fxadapter1 |
|
|
Time elapsed between initial timestamp and entering transformer1 |
|
|
Time elapsed between initial timestamp and exiting transformer1 |
|
|
Time elapsed between initial timestamp and entering liberator1 (the default name for a Liberator is "rttpd") |
|
|
Time elapsed between initial timestamp and exiting liberator1 (usually the message is sent to a client application). |
The timestamp on exiting Liberator (event rttpd1_X in the above table) is only set once, when the first copy of the message is sent to a requesting client. Any other client subsequently receiving the latency record would see only this original value for rttpd1_X. In some cases, Liberator doesn’t add an exit event, such as when the message has been cached and has remained in the cache for a long time before being sent to the client.
|
What record types can hold latency data?
You can put latency data into records of type 1 data format, where the fields are defined by a numeric id and named through a fields.conf file (see Field definition format).
In deployments using Liberator 6.2.10 or later, you can also put latency data in generic data records.
How do I record the initial timestamp?
Recording the initial timestamp using a DataSource API
To start off the chain of latency data you must record an initial timestamp in the relevant data records within the first DataSource application in the chain. This would usually be done in the Integration Adapter from where the data is sent into the Caplin Platform. You create the timestamp by calling a DataSource API function or method on the record, which records the time in the record field whose name is defined by the configuration item LTY_INIT_TS, as explained in How does latency recording work? above. The method you call depends on the language in which you’ve implemented your DataSource application, as follows.
| Warning: For latency recording in generic records to work correctly, the version of Liberator in the deployed Platform must be 6.2.10 or later. |
| DataSource API | Available in versions | API call to record initial timestamp |
|---|---|---|
Timestamping type 1 format records: 6.x and later Timestamping generic data records: 6.2.8 and later (but see warning above) |
Use the (See the "Creating Data Objects" module within the API documentation.) |
|
6.2.7 and later (but see warning above) |
Method (This is the base interface for all record type messages, including generic messages.) |
|
6.2.3 and later (but see warning above) |
Method (This is the base interface for all record type messages, including generic messages.) |
|
6.2.8 and later (but see warning above) |
In the namespace Method (This is the base interface for all record type messages, except generic messages.) Method |
Recording the initial timestamp in a Transformer pipeline
If you want to start recording the latency chain from Transformer (for example, because the data whose latency you want to track has been created in Transformer), you can set the initial timestamp from within a Transformer pipeline.
To do this in Lua:
-
First create the record:
myrecord = DSRecord createrecord (/MYSUBJECT)
-
Set the timestamp field
LTY_INIT_TSto a millsecond value (which would typically be the current time):myrecord:setfield("LTY_INIT_TS", timestampmsec)
This example assumes that the name of the initial timestamp field is the default one. If you’ve defined the name as something different (see latency-chain-init-ts-field), you’ll have to change the Lua code accordingly. Alternatively, in the setfield() call, you can specify the field name by number, rather than by name.
How do I turn latency recording on and off?
By default, latency recording is turned off. To turn it on, define the configuration item latency-chain-enable in each DataSource application in the required chain (you’ll have to stop and restart the applications for the change to take effect):
latency-chain-enable TRUE
You’ll also need to code the first DataSource application in the latency chain (typically an Integration Adapter) to add the initial timestamp field to the records whose latency you want to measure. The other DataSource applications in the chain only add latency times to records that contain an initial timestamp field whose name is defined by the latency-chain-init-ts-field configuration item.
Since latency recording is really only meant to be used as a tool for tuning your system, a flexible way to implement it is to implement the Integration Adapter so that you can dynamically control whether or not it creates records with an initial timestamp. You can then permanently turn on latency recording for all your DataSource applications by setting latency-chain-enable. At run-time, latency records are only sent through the Platform components if you’ve turned on their generation at the Integration Adapter. When latency record generation is turned off, the rest of the components in the chain will still check every record for the presence of the timestamp field, but the overhead of doing this is trivial.
When you deploy a Liberator in the Caplin Deployment Framework, the Liberator fields configuration item requested-fields-only is set to TRUE by default. The effect of this is that, even when latency recording is turned on, Liberator doesn’t send the latency chain data back to clients unless they explicitly request the latency timestamp fields. If you want to always pass the latency data through to clients, you must set requested-fields-only to FALSE; however, this means that all other record updates sent to clients may contain fields that the client is not interested in, increasing the Liberator to client traffic unnecessarily.
| Regardless of whether the latency data is sent to clients, you can always view it using the Caplin Management Console - see How can I… Monitor latency using the CMC. |
How do I change the names of latency chain fields?
To change the names of the latency chain fields from their defaults (LTY_INIT_TS, and so on), define the following configuration items in each of the DataSource applications in the chain. Each application must have the same definitions.
| Field type | Default field name: | Change name using configuration item: |
|---|---|---|
Initial timestamp: |
|
|
List of events: |
|
|
List of timestamp deltas: |
|
How can I add application-specific timestamps?
Timestamping in Liberator
You can add timestamp fields within Liberator in addition to, or instead of, the standard latency chain timestamps described above. The timestamp is a lightweight way of measuring latency; it allows a client application to calculate the time taken for a record to be transmitted to it from the Liberator.
This facility is independent of, the latency chain timestamps, and the recording of the Liberator timestamp isn’t controlled by the setting of the latency-chain-enable configuration item described in How do I turn latency recording on and off? above.
You set up the timestamp field(s) by specifying the timestamp-field configuration item and/or the timestamp-field option of add-object (an add-object timestamp option overrides the global timestamp-field item for the object in question). The Liberator only adds the timestamp-field, and the timestamp within it, to objects that don’t already contain a field of that name. For more about these two configuration items, see the Latency configuration Liberator configuration reference page.
Adding timestamps in Integration Adapters
You can add your own timestamps to records that are being processed by an Integration Adapter. For example, you may want to instrument how long it takes the DataSource application to perform a calculation based on the data in the record. This facility is in addition to, and independent of, the latency chain timestamps described above, and the recording of these custom timestamps isn’t controlled by the setting of the latency-chain-enable configuration item described in How do I turn latency recording on and off? above.
You add custom timestamps in an Integration Adapter, by coding calls to the relevant functions/methods of the DataSource API, as follows:
| DataSource API | Available in versions | API call to add a custom timestamp |
|---|---|---|
Timestamping type 1 format records: 6.x and later Timestamping generic data records: 6.2.8 and later (but see warning above) |
Add one timestamp using the function: void ds_add_latency_chain( ds_data_t *dsdata, char suffix, int64_t millis) Add two timestamps using the function: void ds_add_latency_chain2( ds_data_t *dsdata, char suffix, int64_t millis, char suffix2, int64_t millis2) Use |
|
6.2.7 and later (but see warning above) |
Method (This is the base interface for all record type messages, including generic messages.) |
|
6.2.3 and later (but see warning above) |
Method (This is the base interface for all record type messages, including generic messages.) |
|
6.2.8 and later (but see warning above) |
In the namespace Method (This is the base interface for all record type messages, except generic messages.) Method |
How does Liberator throttling and bursting affect message latency measurement?
Latency measurements are affected by some Liberator configuration settings. The two main features that can delay messages are throttling and bursting.
Object throttling by default is set to 1 second, which means that an update could be delayed by up to 1 second as a result. Bursting on client session output is set by default to 0.5 seconds, so an update could get delayed by a further 0.5 seconds on top of the throttling delay. Both these features have their benefits; throttling prevents sending out multiple updates to the same object in a short space of time, while bursting can improve overall performance in a system with a large number of clients by batching together small messages when output to a client. You can turn throttling off if it has a detrimental effect on latency, but you should always have a burst setting, even if it’s a small value such as 0.1 seconds.
See also:
-
Reference: DataSource Latency chains configuration
-
Reference: Liberator Latency configuration
-
How can I… Monitor latency using the CMC