Visualising Prometheus metrics with Grafana
This page explains how to use Grafana to provide rich monitoring dashboards for a Caplin Platform deployment.
For information on configuring real-time alerts based on Prometheus metrics, see Publishing alerts from Prometheus.
Overview
Grafana is a leading visualisation server for time-series data. Platform 8’s Prometheus metrics have been redesigned to allow you to create reusable Grafana dashboards for Liberators, Transformers, and adapters in your deployment.
This page describes how you can set up a Prometheus server to collect Prometheus metrics from your Caplin Platform 8 deployment, and how you can set up a Grafana server to visualise that data.
Walkthrough
In this walkthrough, we’ll deploy Liberator, Prometheus, and Grafana, and then import the example Grafana dashboard included with Liberator 8.
Deploy Liberator 8
Liberator 8 can be deployed in three different ways:
-
Deploy to the Caplin Deployment Framework
-
Deploy as a standalone server
-
Deploy as a Docker image
For the purposes of this walkthrough, we’ll keep things simple and run Liberator in the Platform Core Docker image, available from the docker-release.caplin.com registry (Caplin account required).
-
Open a new terminal and run the command below to start Liberator in a Platform Core 8 container:
docker run --rm --name liberator --interactive --tty --publish 8083:8083 --publish 18080:18080 docker-release.caplin.com/platform/core:8.0.0 /app/DeploymentFramework/dfw start-fg Liberator
The command above runs Liberator in an interactive foreground container. When you want to stop Liberator, press Ctrl-C in the terminal window.
-
To view the metrics exported by Liberator, navigate to http://localhost:8083/metrics. You will see output resembling the sample below:
# HELP rttpd_session_connections_permitted gauge
# TYPE rttpd_session_connections_permitted gauge
rttpd_session_connections_permitted 1
# HELP rttpd_process_fds gauge
# TYPE rttpd_process_fds gauge
rttpd_process_fds{type="non_socket_fds"} 27
rttpd_process_fds{type="socket_fds"} 535
# HELP rttpd_data_service_messages_read_total counter
# TYPE rttpd_data_service_messages_read_total counter
rttpd_data_service_messages_read_total{service_name="broadcast",message_type="nodata"} 0
rttpd_data_service_messages_read_total{service_name="ContainerTestsService",message_type="map"} 0
Deploy Prometheus
Follow the steps below:
-
Download the latest version of Prometheus from the Prometheus Download page, and extract it to a local directory:
Example directory structure following download and extraction -
In the Prometheus root directory, edit
prometheus.ymland add a scrape job for Liberator in thescrape_configssequence:prometheus.ymlscrape_configs: - job_name: "liberator" scrape_timeout: 30s scrape_interval: 40s static_configs: - targets: ["localhost:8083"] -
If Liberator is not already running, open a new terminal and start Liberator now:
docker run --rm --name liberator --interactive --tty --publish 8083:8083 --publish 18080:18080 docker-release.caplin.com/platform/core:8.0.0 /app/DeploymentFramework/dfw start-fg Liberator
-
In the Prometheus root directory, start Prometheus:
./prometheus
-
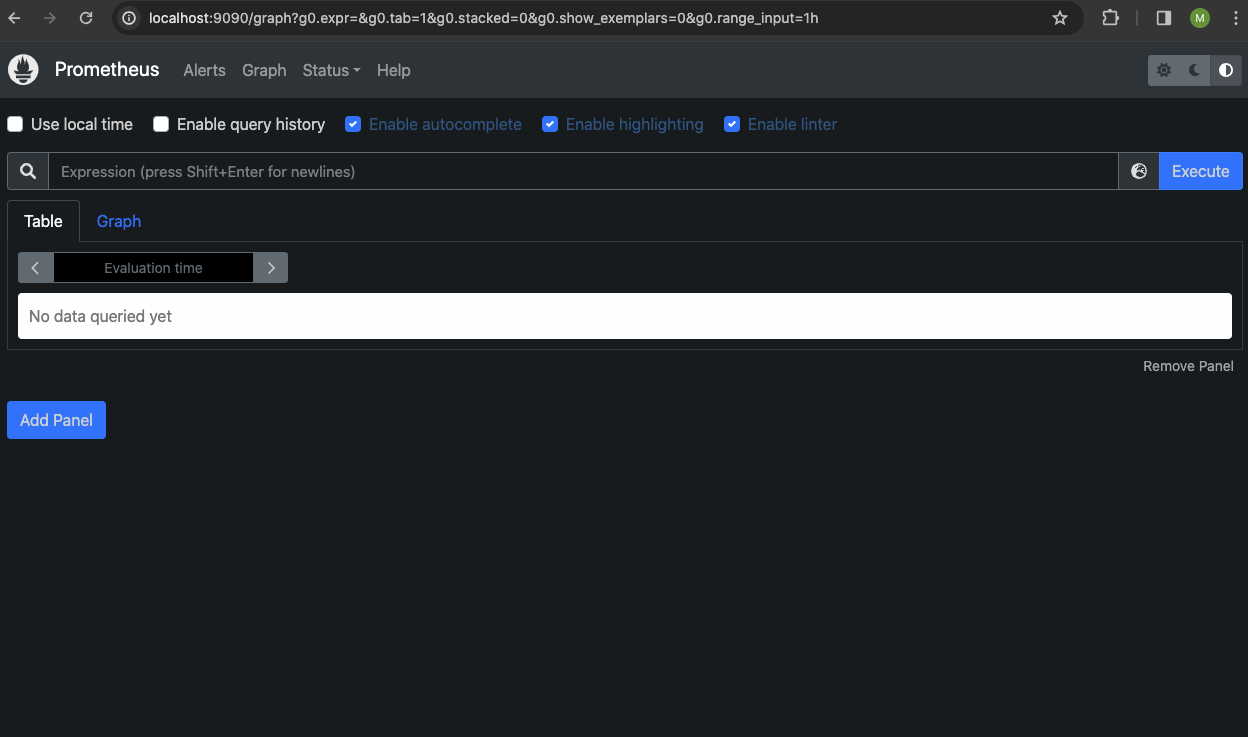
In a web browser, navigate to http://localhost:9090 to confirm that Prometheus is running:
-
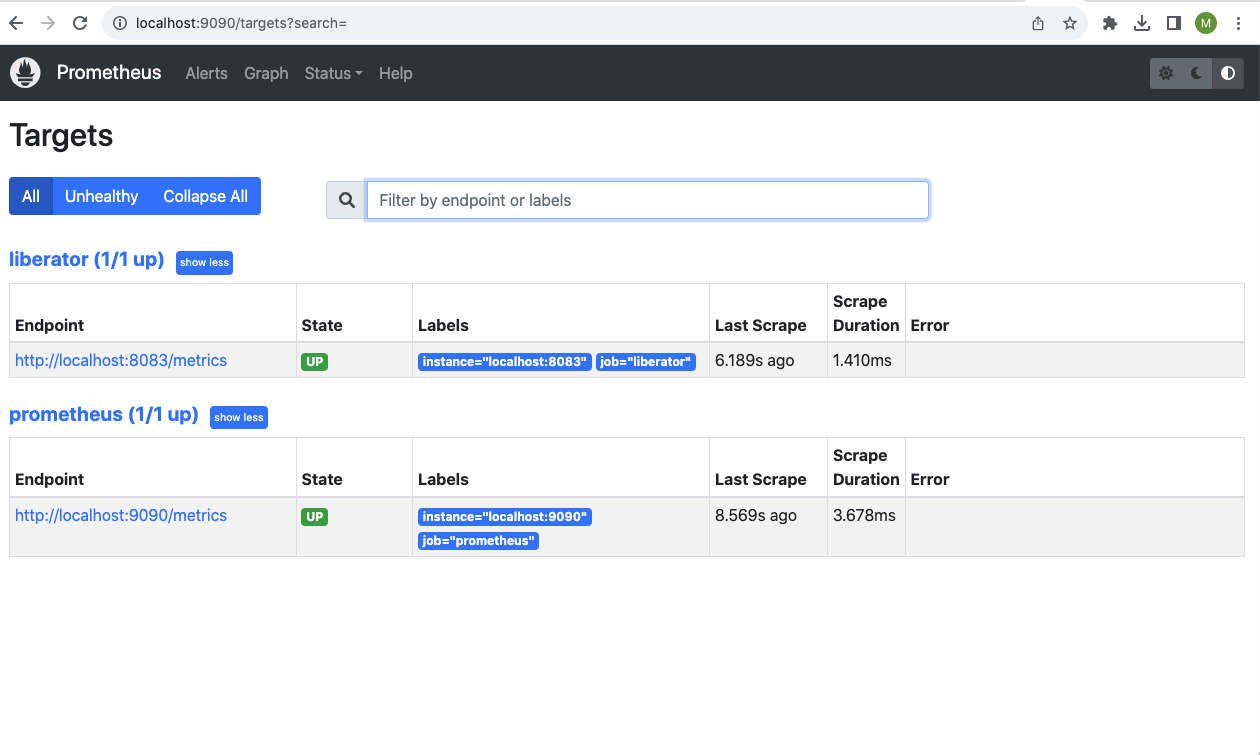
On the Prometheus home page, click Status > Targets to confirm that Prometheus has detected that the Liberator is 'up':
Deploy Grafana
Follow instructions here to install and start Grafana: Install Grafana
The Grafana server is accessible at http://localhost:3000.
To sign in to Grafana for the first time, follow instructions here: Sign in to Grafana.
Import example Liberator dashboard into Grafana
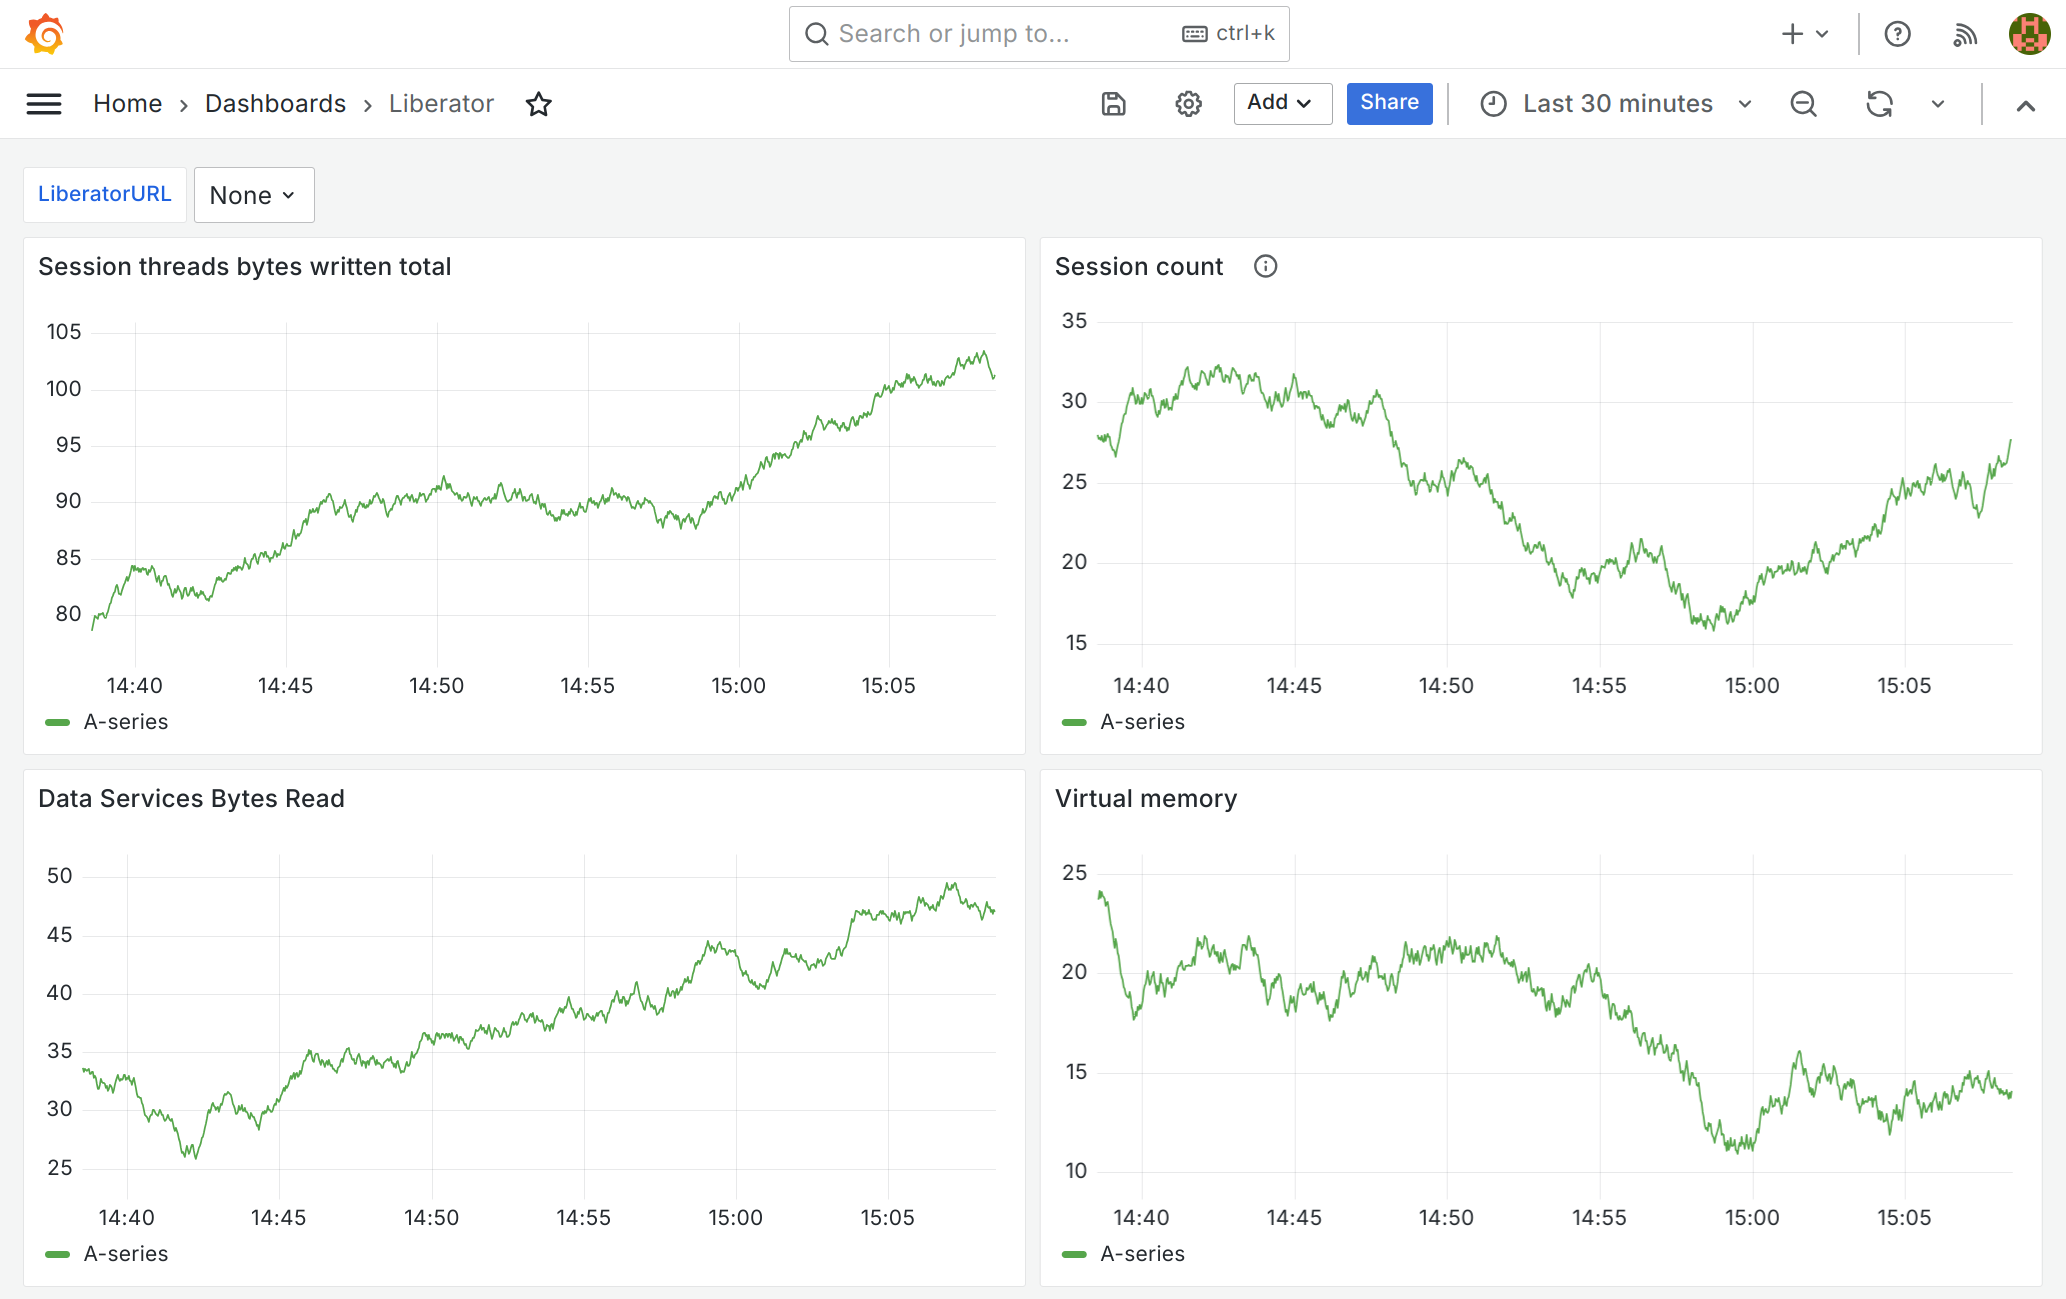
Liberator 8’s deployment kit includes an example Grafana dashboard that visualises metrics from any Liberator 8:
To get a copy of grafana-dashboard.json, either download the Liberator deployment kit from Caplin Downloads, or copy the grafana-dashboard.json file from the 'liberator' container you started earlier:
docker container cp liberator:/app/DeploymentFramework/kits/Liberator/Latest/doc/Monitoring/Grafana/grafana-dashboard.json .
Follow the steps below:
-
In the Grafana UI, on the Home > Dashboards page, click New > Import
-
Drop the example
grafana-dashboard.jsonfile on the Upload box: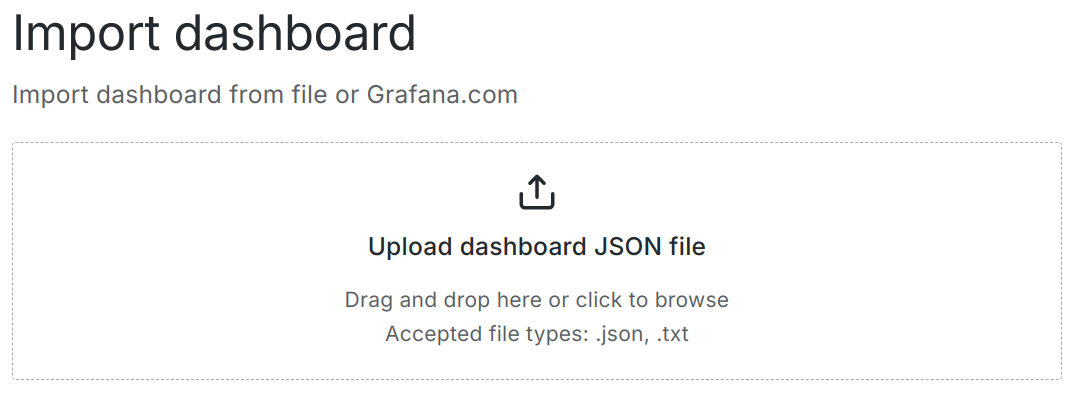
-
Choose a name and location for the new dashboard:
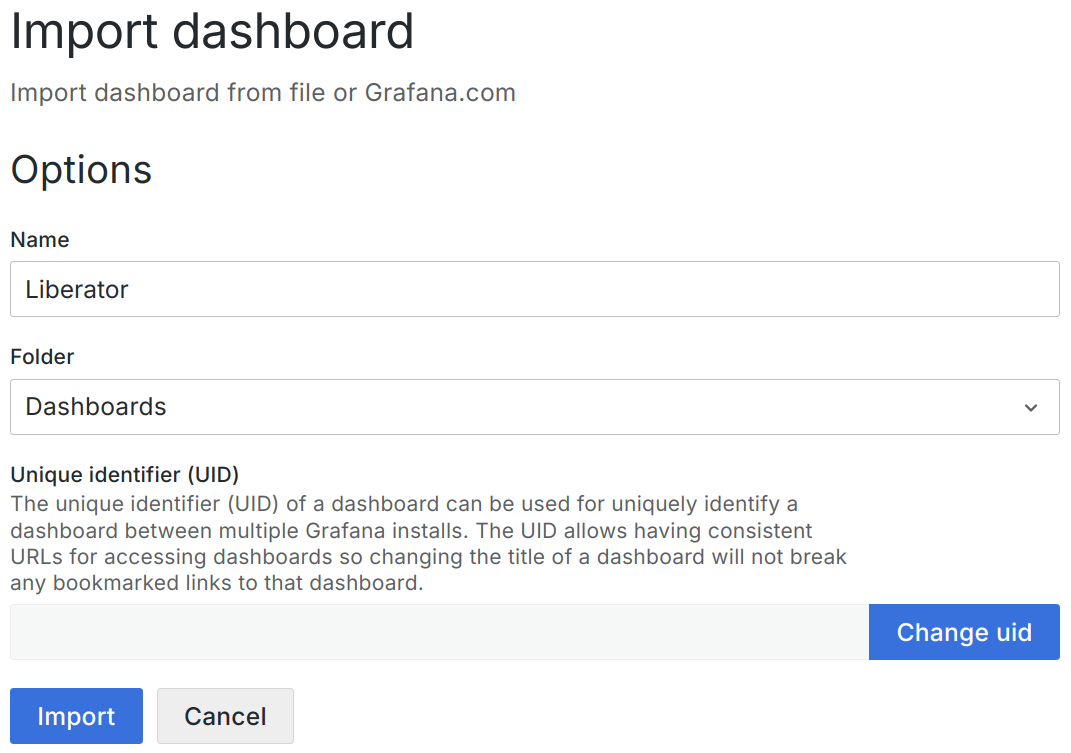
-
Click Import to import and display the new dashboard: