Capture StreamlinkJS logging data
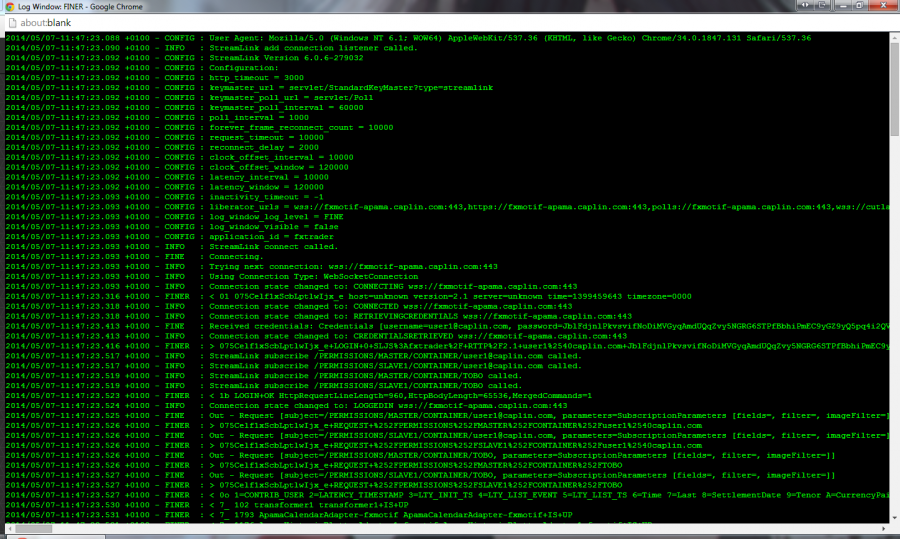
You can set StreamLinkJS to display the messages sent between the client and Liberator by adding ?debug=finer to the URL. The addition of this key-value pair to the URL causes SLJS to open a popup window when it connects to Liberator. The window contains a formatted view of all of the current configuration, connection handshake, permissions, trade message, and updates. This log can be vital when diagnosing an incident, especially when paired with other server-side logs, such as the Liberator packet log and authentication logs.
Please be aware that most browsers will block popup windows and so you may have to explicitly allow popups to be opened for the domain the application is running under.
The debug log will look something like this:
Sending logs to Support
When Caplin Support ask for the client logs it is best if the all of the contents of the debug window are selected (Ctrl+A) and then copied and pasted into a simple text file. This text file can then be emailed or attached directly to the issue logged in Jira.
See also: